BIOENGINEERING METHODS & APPLICATIONS: LAB REPORTS
Course Description: Bioengineering Methods and Applications uses laboratory experiences to illustrate principles taught in several bioengineering core classes, such as Cell Biology, Biothermodynamics, Biotransport Phenomena, Bioinstrumentation, Biosignals & Systems, and Biomechanics Principles. In addition to being exposed to particular laboratory skills for each of the experimental modules in the course, students are expected to practice previously developed skills in creating tables and graphs, data analysis, and statistics to create laboratory reports that document each module.


GAIT MODULE
Humans navigate uneven terrain each day, traversing rough streets, icy sidewalks, or even cobblestone driveways. These diverse terrains often affect a person’s locomotion, which can include step length, energy expenditure, and other biomechanical properties. Uneven terrains change the points of action and direction of the ground reaction force that alter based on the ground contours, causing steps to be perturbed differently, and ultimately someone’s gait. Gait analysis is the study of how the body works, typically via walking, from one location to another, and it entails measurements of the biochemical features associated with moving.
The main purpose of this study is to gain a better understanding of the unpredictable nature of gait and the associated parameters (average gait parameters and gait variability parameters). The kinematics about the movement and the kinetics that causes the corresponding movement were considered while examining how subjects allowed over a vinyl tile floor (flat surface) and soft carpet with block perturbations (uneven surface). Finally, the joint angle and gait parameter changes over the various gait cycle phases were observed to provide insights that could help fall prevention.
OBJECTIVE:
The objective of this module is to examine how walking on a soft floor (uneven), simulated by a carpet over a wooden floor with irregular wooden blocks affixed to it, in dim lighting affects gait kinematics. The control trial is a hard vinyl tile floor (flat) with bright lighting.
Use MATLAB to solve for:
-
Joint Angles
-
Spatiotemporal Gait Characteristics
-
Gait Speed
-
Step Length
-
Step Width
-
Cadence
-
Stance Duration
-
Swing Phase Duration
-
Double Limb Support Duration
-
-
Gait Variability
CONCLUSION:
Typical gait patterns are altered when walking across an uneven terrain in dim lighting. The added obstacles change the normal gait cycle by increasing flexion and bending of all joints, hence lowering one’s center of mass closer to the ground to improve balance and stability. The uneven terrain and dim lighting appeared to cause the subject to take significantly fewer steps per minute while still maintaining a relatively similar speed to the flat surface trials. The lack of steps taken on the uneven surface was counteracted by step length in order to maintain a speed similar to that of the flat surface trials. In conclusion, in order to prevent falls and trips on uneven surfaces, it is important to increase bending, including lifting one’s toes further from the ground during toe-off and swing, and increase stride length. Though it may add minimal additional time to the gait cycle, the benefits outweigh any negatives as tripping or falling is less likely.
REPORT SUMMARY
LAB SETUP
The objective of this lab is to observe how gait kinematics can be affected when walking on a soft floor in dim lit conditions. For the experiment to be valid, the subject must successfully complete the control trial (bright light, hard floor) and test trial (dim light, soft floor) without falling. A subject will be studied walking across a vinyl-tile floor in well-lit conditions and a carpeted floor in dim-lit conditions, simulating an environmental difference to compare gait kinematics. In order to collect spatial data, reflective markers will be placed on several anatomical positions and the data will be recorded using an IR camera marker tracking system (T series, Vicon Motion Systems, Oxford, UK, http://www.vicon.com/System/TSeries). The analysis of the change in gait kinematics will follow. Please refer to the Analyzing Human Gait test plan summary in the attached document.
To reach the goal of our objective, test (experimental) protocol AHG-001 will be utilized. A subject will be asked to walk across different surfaces to see the effect it may have on gait kinematics. Reflective markers will be attached to the sternum, right/left shoulder, right/left head of trochanter, right/left knee, right/left ankle, right/left heel, and right/left toe. To calibrate the IR camera marker tracking system, the subject will be asked to stand with legs straight and arms extended outward for a static trial. Under lights set to full brightness, the camera should collect data in the X, Y, and Z position at 120 Hz while the subject walks across the vinyl floor at a self-selected speed. Then, the subject will repeat the same actions on the carpeted test flooring with the lights set to a low brightness. The 3-dimensional data collected will be loaded into MATLAB software and processed to determine joint angles and spatiotemporal gait parameters. In addition, the standard deviation of pertinent parameters will be calculated to study gait variability. The subject must not fall when completing the static, control, and test trial. There must be no missing marker data.
TEST RESULTS


DISCUSSION
All average joint angles, according to Table 1, were larger during the flat surface trial than during the uneven surface trial, indicating that more flexion and joint bending occurred during the uneven surface gait cycle. To preface, the joint angle convention used in this experiment is established so that larger, more positive angles indicate extension, and that smaller, closer to zero numbers indicate increased flexion of the joint. This joint convention is appropriate for this experiment, as the angle being analyzed is the angle between two anatomical segments: the proximal segment and the distal segment. The angles between the proximal and distal segments of the hip, knee, and ankle were smaller during the uneven surface trial, indicating increased joint flexion. These results are in agreement with Alexandra Voloshina’s findings presented in the Biomechanics and energetics of walking on uneven terrain, which also states that there is greater flexion experienced, particularly in the knee and hip joints, while walking across uneven terrain [1]. There is only one exception in this joint convention, as seen in Figure 1, where a larger angle does indeed indicate greater flexion rather than extension. In the foot-floor angle plot, the angle between the foot and the floor is larger during the uneven surface trials than the flat surface trials, whereas in the ankle joint angle, knee joint angle, and hip joint angles, the angle between the proximal and distal anatomical segments is larger during the flat surface trials than during the uneven surface trials. Though the logic behind these scenarios are different from one another, they actually both indicate the same result: increased bending and flexion angles while walking on an uneven surface. The foot-floor angle was larger on the uneven surface, indicating increased dorsiflexion, as the subject most likely lifted their toe up higher, and had a steeper heel strike, so that they would not trip on the uneven surface. In general, the hip, knee, and angle joint angles were smaller, indicating larger flexion, during the uneven surface trials because the subject most likely bent their legs more to help improve balance. Bending one’s knees, and thereby bending their ankles and hips, helps to lower their center of gravity and improve stability and balance, particularly on uneven surfaces.
Regarding gait patterns, the averages do not follow a similar pattern like the joint angles did. The gait speed for both the flat and uneven surface trials is extremely similar, with the flat surface gait speed being only 0.02 m/s quicker than the uneven surface gait speed. Average step length on the flat and uneven surfaces is relatively similar, with the latter having a slightly larger average step length, as well as the standard deviation being nearly three times as large as the former’s. Step length, unpaired with another variable, does not indicate ample information on its own. However, when analyzed with cadence and gait duration, step length can provide a lot more insight. The cadence (steps/min) during the flat surface trials was significantly larger than the uneven surface cadence. A theory as to why subjects may take fewer steps per minute on the uneven surface but still maintain a similar speed to the flat surface trial is step length. As mentioned previously, though the average step lengths only vary slightly from each other, there is the matter of standard deviation and how that may have affected the cadence. The uneven surface may have caused the subject to take fewer, longer steps in order to avoid stepping on the uneven surface more than needed, all while maintaining a relatively similar speed as the on a flat surface. Stance duration during the gait cycle was slightly slower when traversing an uneven surface compared to a flat surface. According to Kelly Hawkins in Walking on uneven terrain in healthy adults and the implications for people after stroke, “during stance, improved stability on an uneven surface is achieved by reducing the height of the center of mass” [4]. Not only does this statement align with the previously stated conclusion on increased bending and flexion on uneven surfaces, but gives a probable reason for increased stance duration. This improved balance during gait on an uneven surface is achieved at the cost of speed. In a similar manner, the swing phase duration on the uneven surface is longer than that of the flat surface. For the same reason as stance duration, it is reasonable to conclude that the uneven surface would encourage the subject to take fewer, longer steps, both in distance and duration. Though the gait speed was nearly identical between the flat and uneven trials, the uneven trial’s speed was slightly slower, aligning with the finding that the uneven surface produced longer stance and swing durations. The double limb support duration was larger during the flat surface trials in comparison with the uneven surface trials, aligning with the assumption that the uneven surface subject likely aimed to spend less time with their feet on the ground. A shorter double limb support duration indicates a quicker turnover from one leg to another. Overall, walking across an uneven surface in comparison to a flat surface appears to modify the gait cycle by increasing joint flexion angles and by altering typical gait patterns, particularly cadence.
LIGAMENTS MODULE
There were two purposes for this experiment. The first was to understand the mechanical testing principles and experimental techniques utilized to determine the properties of engineering materials and biological tissues, specifically, soft tissues. The second was to analyze the mechanical properties of the respective engineering material and biological tissue, specifically a nylon cable tie, and the biological tissue used was a porcine MCL. To accomplish this objective, the mechanical properties of the porcine MCL and nylon cable tie were compared by observing their stress-strain curves after being separated individually on a materials testing machine and calculated the intra- and inter-observer repeatability with respect to a tibia and metal rod measurements. To test the mechanical properties, a uniaxial tensile test was performed, a process where a load is applied to the specimen in an appropriate manner and aligned with all axes of symmetry until failure is reached. After, ultimate stress and strain were calculated to determine how these materials were characterized.
OBJECTIVE:
To understand the mechanical testing principles and experimental techniques utilized to determine the properties of engineering materials and biological tissues – specifically, soft tissues. The mechanical properties of a porcine MCL and nylon cable tie will be compared.
To Be Accomplished in this Lab Module:
-
Calibrate a displacement transducer
-
Perform repeated measurements with dial calipers
-
Measure the width and thickness of a nylon cable tie and and ligament
-
Utilize a materials testing machine to record the load-elongation of a nylon cable tie and bone-ligament-bone complex
-
Construct a stress-strain curve for the nylon cable tie and medial collateral ligament (MCL) using the collected data
-
Determine mechanical properties of the nylon cable tie and ligament substance
-
Calculate intra- and inter-observer repeatability of the dial caliper
CONCLUSION:
The stress strain curves for the nylon cable tie and porcine MCL are distinct, with the MCL having an initial nonlinear region during recruitment of ECM collagen fibers. The porcine MCL has a lesser modulus than the cable tie, suggesting that the MCL is more deformable than the cable tie when exposed to the same tensile forces. These mechanical properties mirror the distinct functions of each material.
REPORT SUMMARY
LAB SETUP
Utilizing the ligament biomechanics lab module, the mechanical properties of the nylon cable tie and porcine MCL can be determined. Considering both specimens have a uniform geometry and stress and strain field, an accurate analysis can be conducted. Both the nylon cable tie (USA Strong Products, Part Number: USA8NATM, Florida) and the porcine MCL will be prepared appropriately to measure the stress and strain at the midsubstance of each so the data can be assumed for a uniform stress and strain distribution in the rectangular geometry. To perform proper testing on the porcine MCL to determine the material properties of biological tissue, the specimen must be prepared by removing all the soft tissue from the tibia and femur, excluding the MCL. This will allow isolation and testing of the properties of only the ligament substance. Bone blocks are cut for mounting purposes while testing and do not interfere with the MCL. The midsubstance will then be marked on the hydrated tissue to maintain uniform geometry and consistency between testing both materials. To test the mechanical properties of respective engineering material, a nylon cable tie will be cut 8 centimeters long and marked at the midsubstance for the same purposes.
Next, the ultimate strain may be determined for the porcine MCL, assuming failure at the midsubstance, using the Differential Variable Reluctance Transducer (Microstrain, inc., Burlington, Vermont), also known as the DVRT. The DVRT must be set up and given time to warm up for at least 15 min in order for it to be calibrated. From there, a calibration curve will be generated by finding a reference point making the barbs 8 mm apart and finding the slope of the linear region using Microsoft Excel. A calibration curve compares the voltage between distance of each barb of the DVRT. The voltage is measure using a Voltmeter (Craftsman, 9V NO06120385, United States). Strain can then be calculated with the information provided by the calibration curve and voltage output from the DVRT and voltmeter.
For the outcome of most precise and consistent data, as described earlier, intra- and inter-observation was performed. This refers to repeatability, which allows the assessment of the precision of the collected data. Intra-observer repeatability is described as measurements taken by the same individual versus inter-observer repeatability refers to measurements taken between several individuals. The cross-sectional area is the determined by measuring the length and width of the midsubstance of both the nylon cable tie and porcine MCL using a dial caliber (Anytime Tools, Part Number: AT203185, Granada Hills, California), assuming the midsubstance is rectangular.
To prepare for mechanical testing, the nylon cable tie and porcine MCL must be mounted and aligned into the materials testing machine (INSTRON, 5965, Norwood, Massachusetts) to determine load-elongation. Before mounting, verify the machine is in position control before placing each lax specimen one at a time into the clamps at the central axis of the load cell. Tighten the clamp bolts to hold the specimen being tested in place. Now that the specimen is fixed in the clamps of the materials testing machine, the preloading procedure will take place by applying 2 N to the specimen. The preloading mechanism rids the specimen of any slack and allows for application of immediate upward force at the beginning of the test. For the cable tie only, measure the clamp-to-clamp distance to perform strain calculations. Next, the specimen will be preconditioned to reduce hysteresis by cycling it between two limits of elongation. Only for the porcine MCL, the DVRT will be carefully placed in the tissue having each barb on the line marking the cross-sectional area of the midsubstance, parallel to the ligament fibers. For the load-to-failure procedure, the crosshead will be raised until failure of the specimen and the load and elongation will be recorded. The specimen can then be removed from the materials testing machine and the DVRT may be removed from the porcine MCL. The failure mode will be recorded for further analysis and the mechanical properties of each specimen may be determined.
TEST RESULTS


DISCUSSION
In this experiment, some measurements are made by humans with dial calipers; therefore, there is some concern about the impact of human error and reliability in the results. Repeatability is an important parameter to assess when making measurements, as more reliable measurements allow for drawing more powerful statistical conclusions. To assess the impact of repeatability, intraobserver and interobserver reliability were calculated for the length of a metal rod and the distance between the most superior point of the tibial plateau and the most inferior point of the tibial tuberosity. As predicted, intraobserver repeatability was significantly more precise for both observers (as seen by the lower standard deviation) in measuring the rod rather than the biological landmarks. This is likely due to the geometry of the systems measured. In the rod, the two points are very well defined and fit nicely between the prongs of the dial caliper; however, the points of tibia are more subjective, which introduces variability in selecting the points to measure between. Additionally, the two points do not fit within the caliper prongs, making it harder to use the instrument for the tibial measurements.
Interobserver repeatability was relatively constant for measurements within the rod, likely same reasons discussed above. For tibial measurements, however, there was a marked decrease in interobserver repeatability. This is to be expected when making measurements between two subjective points, as different people will measure the distance between slightly different points, creating a greater variability in the value measured. For this experiment, repeatability is a great concern when making cross sectional area measurements. Based on these results, the cross-sectional area of the cable tie should have a fairly high confidence, as the measurement is made between distinct points that can be enclosed by the prongs of the caliper. For the porcine MCL, measurements are made between distinct points mimicking the rod; however, the MCL cannot be enclosed by the prongs of the caliper, as the soft tissue will deform as the caliper is closed, resulting in inaccurate measurements. Thus, the distance must be measured without touching deforming the tissue, resembling the inability to close the two points of the tibia within the caliper prongs. All things considered, the cross-sectional area measurement of the cable tie should have a greater repeatability than that of the porcine MCL.
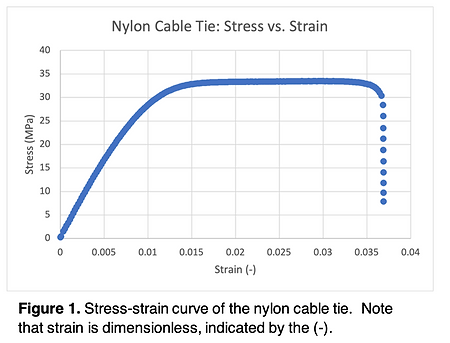
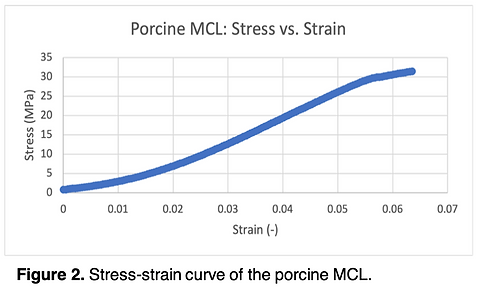
The nylon cable tie had a standard stress strain curve (Fig. 1). Initially, the curve is linear before the yield stress is reached, at which point it plateaus until failure at the midsubstance. The porcine MCL (Fig. 2) had a similar stress strain curve, with a linear region and a slight plateau before failure; however, the MCL also had an initial nonlinear, ‘toe’ region. This major difference is due to the intrinsic properties of the material. The MCL undergoes an initial deformation in which fibers of the extracellular matrix are recruited and aligned properly to counteract the loading, whereas the nylon cable tie has a fixed rigid geometry in which the entire cross sectional area is immediately engaged. The MCL had a much smaller modulus than the cable tie, meaning that the MCL is less stiff than the cable tie and requires less force per unit area to create a given deformation. This aligns with the different functions of each material. The nylon cable tie is commonly used to create a rigid attachment between two substances. If the cable tie were easily deformed, it would not meet its intended function. Conversely, the MCL is meant to create a flexible attachment between the femur and tibia. By being flexible and easily deformable, supports motion around the knee while maintaining the structural stability of the joint.
The cable tie manufacturer lists the tensile strength of the material as 222.5 N, corresponding to an ultimate stress of 33.2 MPa based on the cross-sectional area of the cable tie [2]. This is almost exactly the value experimentally determined in Table 2, providing support for the methodology and further support for the high reliability of measuring rigid materials. Unfortunately, the porcine breed used in this study is unknown, and different breeds of porcine have different mechanical properties [3]. Therefore, the calculated experimental values will be compared to the mean value between the Yorkshire and red Duroc values. Across the Yorkshire and red Duroc left and right MCLs, the mean modulus varied from 327.6 MPa to 477.8 MPa [3]. In this experiment, the porcine modulus was calculated to be 553.6 MPa (Table 2), which is reasonable as it still falls within one standard deviation of the left Yorkshire MCL modulus [3]. This variability likely comes from the innate variability between the pigs, including age, size, breed and physical activity before the MCL was harvested. Because the MCL failed at the tibial insertion site rather than the midsubstance, this study is unable to conclude the true ultimate strain or ultimate stress of the MCL midsubstance.
This study could be improved in future iterations to provide more physiologically representative data for the MCL. For example, the stress strain analysis could be repeated in a saline tank to prevent dehydration of the tissue. A heater could be added to this tank to determine the mechanical properties at physiological temperature rather than room temperature. Additional error may be the result of unprecise measurements with the dial calipers. Measuring deformable biological tissue presents an inherent challenge of getting accurate measurements, as touching the tissue can cause deformations creating inaccurate measurements. To obtain the most accurate and precise measurements, a non-contact imaging technique such as MRI or CT could be used to determine cross sectional area; however, the added time and cost may render such a technique impractical for a trivial improvement in precision.
HISTOLOGY MODULE
In this study, H&E staining was used to qualitatively analyze histomorphological differences between a normal vagina and a vaginal tissue that had polypropylene mesh implanted. We aimed to compare samples which underwent mesh implantation and our controls as well as understanding whether there was a significant morphological/host response using histological staining. We hypothesized that the mesh implanted vaginal tissue would show a large foreign body response; this response would cause significant changes to the tissue structures, including an increased inflammatory reaction. Understanding the differing structures will help to understand why women that underwent a transvaginal mesh procedure faced complications.
OBJECTIVE:
To identify histomorphological differences between a normal vaginal tissue and a vaginal tissue with foreign body response (caused by polypropylene mesh) using a histological method.
Lab Activities: In Histology Session I, students practice a commonly used staining method – Hematoxylin and Eosin staining (H&E) with pre-processed tissue sections on glass slides. In Session II, students observe the tissue morphology under a microscope and take
large images for image analysis.
Analysis: In Histology sessions, students identify four common tissue types - epithelium, connective tissue, muscle, and nerve (nerve may not be observed in the slides) and describe foreign body-induced morphological differences in mesh ungrafted vs. grafted vaginal tissue.
CONCLUSION:
A qualitative analysis showed a thickening of the adventitia and thinning of the muscularis, supporting the theory of stress shielding. In addition, deposits of granulomas were present around the mesh implant, indicating chronic inflammation around the implant and helping to explain the manifestations of pain in subjects with postoperative complications. Future studies with larger cohorts could utilize more specific staining techniques to explore alterations in the ECM composition due to the lessened stress on the native tissue.
REPORT SUMMARY
LAB SETUP
The histology of the vaginal tissues is accomplished using hematoxylin and eosin (H&E) staining in this study. Histology is the practice of observing a stained, thin section of tissue under a light or fluorescent microscope. In order to study how the mesh affects the vaginal tissues, we needed to study morphology using H&E staining. Starting with fixation to preserve tissue structure, the tissue is embedded in a solid medium. In this study, we used resin for preservation and visual purposes. Once the preparation is complete, we start staining. In order to compare tissue samples to determine a difference in morphology, we decided H&E staining would reveal the most significant changes. The stain would show the distinction between each tissue type, and allows us to draw conclusions as to why it is the way it is comparing the control tissue to the tissue with the imbedded mesh. The stained tissue allows differentiation between different types of tissues in a sample. The tissue is stained using a variety of chemicals or dyes. Hematoxylin is a flavone dye to stain the nucleus using aluminum or iron (figure 1). Hematoxylin leaves a purple-colored stain on genetic material. Eosin is an anionic xanthene dye that stains the tissue red where there is cytoplasm or extracellular matrix (figure 2). The eosin will allow us to highlight the connective tissues in the slide sample and create a distinctive separation of tissue composites. Under the microscope, you can observe these color changes in the tissue and identify the different tissue types. This will allow us to study and compare morphology.
Taking each slide containing the tissue, several solutions are used to reach our obtained goal of proper tissue staining. There are fourteen different tanks in a ventilation hood containing the desired solutions in the order of the staining process. The multiple tanks were utilized to separate each step with each different solution to be as precise and authentic as possible while staining. The fume hood was utilized to ventilate the fumes from the chemicals during the staining process. These tanks were filled with various chemicals such as H&E as well as many wash steps in between in order to remove traces of prior chemicals so only the desired product is stained. Each tank had either a specific time period or number of dips (equivalent to a single time each slide was submerged into the solution) that was instructed for successful H&E staining. After the tissue slide completes the staining process, a small amount of resin will be placed on the tissue and covered with another glass slide. This will allow us to fixate the tissue slide after the staining and will allow us to analyze it under the microscope. When ready to analyze the H&E staining for different tissue morphology, the slide is placed under the Light and Fluorescence Microscope (NIKON) for images to be taken of mesh-ungrafted and grafted tissue. The successful analysis of the tissue morphology was then determined by comparing the control subject with the mesh implant subject.
TEST RESULTS

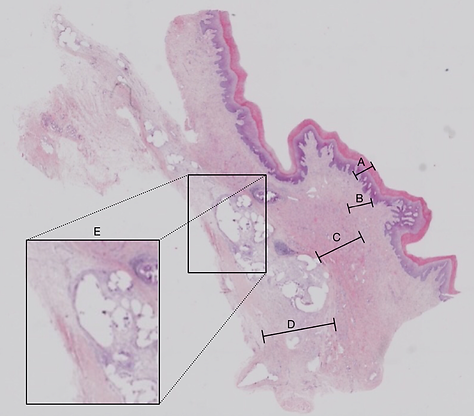
Figure 4. Image of vaginal tissue with propylene mesh. A) Epithelium B) Subepithelium C) Muscularis layer D) Adventitia layer E) The white “pocket” is where propylene mesh adhered to the vaginal tissue
Figure 3. Image of the control vaginal tissue. A) Epithelium B) Subepithelium C) Muscularis layer D) Adventitia layer E) Tissue folded over itself
DISCUSSION
Polypropylene mesh implants show evidence of morphological remodeling and chronic inflammation, suggesting that there is an imperfect integration of the mesh into the patient. These findings are consistent with our hypothesis that implant complications, such as pain, are the result of physiological changes around the mesh preventing the proper incorporation of mesh into the host tissue.
In comparison to the control subject, the muscularis is much thinner while the adventitia appears to be thicker in the subject with mesh implant. These morphological alterations are consistent with current literature and can be explained by the phenomenon of stress shielding, where the mesh bears most of the load rather than the soft tissue [2, 5]. With the mesh implant in place, the soft tissue of the vaginal wall supports a smaller fraction of the weight of the uterus; therefore, the tissue undergoes a maladaptive process that results in loss of smooth muscle, collagen, and elastin [5]. The thickening of the adventitia is likely the result of mesh integration, as the tissue grows around and incorporates the mesh into the outermost layer of the vaginal wall.
The thinning of the muscularis may present risk of developing adverse symptoms, such as mesh exposure through the epithelium. The hematoxylin and eosin staining could not confirm mesh exposure, as the vaginal epithelium appears to be continuous across the section. It is possible that there could have been mesh exposure elsewhere in the vagina, in a region where the biopsy was not taken. It is important to note that the mesh was only implanted three months before the tissue samples were collected. These implants are not designed to be removed; hence, some complications may arise later than three months post operation. Retroactive studies could be performed by looking at time after operation that symptoms of mesh exposure appear to explore the role of time in implant complications.
Another stark difference is the presence of granulomas around the mesh. Because the implant was embedded three months before this biopsy was taken, these granulomas are indicative of chronic inflammation. This result has been well documented, as other studies have found an upregulation in proinflammatory M1 macrophages around the implant site [4]. These granulomas release signaling molecules to recruit an immune response. These molecules also make nociceptors hypersensitive, making patients more perceptive to pain and sensitivity around the implant [6]. This ultimately serves to create a link between the pain experienced by the patient to long term cellular remodeling and inflammation around the mesh implant.
Of important note, the mesh implant experimental group (Appendix A) showed no signs of the mesh implant, which would most obviously appear as gaps where the tissue grew around the polypropylene mesh. The subject this sample was taken from did have a mesh implant; therefore, this result illustrates one of the potential issues with histology and microscopy: the need for thin tissue sections. Typical section thicknesses are between five and ten microns; thus, it is possible for the tissue section to have come from gaps between mesh linkages and show no signs mesh. With a larger sample size, there would be a greater likelihood of obtaining sections traversed by mesh, showing the morphological differences of interest. To allow for a proper analysis of the morphological differences around the mesh implant, an image was provided that was traversed by the polypropylene mesh.
This study is somewhat limited in its ability to draw novel conclusions due to its small sample size. Rather, the aim of this paper has been to confirm previous findings in the morphological changes resulting from vaginal polypropylene mesh implants. Future studies with larger cohorts will be able to draw more meaningful conclusions, especially if quantitative methods are used. For example, a future study could explore changes in extracellular matrix (ECM) composition with a trichrome stain to find further support for the stress shielding theory. Through this stain, investigators could also quantify changes in the area, thickness, and cellular density of each layer through a quantitative image analysis. In addition, future studies could also utilize immunofluorescence to target specific markers, such as CD86 to differentiate proinflammatory M1 macrophages from pro-remodeling M2 macrophages.
BLOOD PUMPS MODULE
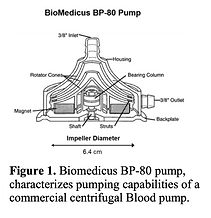
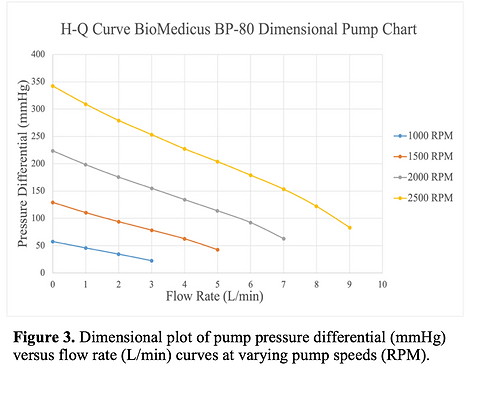
In the experiment, an integrated pump on the artificial lung was tested to stimulate the Biomedicus BP-80 pump, a commercial centrifugal blood pump, in order to evaluate its pumping abilities, and ultimately generate a pump curve. The pump-lung system drives blood flow through a hollow fiber membrane (HFM) gas exchanger. In this experiment, a blood substitute (carboxymethyl cellulose - CMC - solution) was prepared and used as a blood stimulant, as it has a similar viscosity to blood. After obtaining pressure values for increased CMC flow for the Biomedicus BP-80 at varying pump speeds and volumetric flow rates, pump curves were generated to measure/predict the pumping capabilities. A consideration throughout the entire experiment was that the proposed pump must be optimized to be as small and feasibly possible as the system is meant to be worn by children. In order to do so, dimensional analysis had to be used as it allows researchers to take pressure flow data from a larger pump and ultimately design a smaller pump for pediatric application.
OBJECTIVE:
Aid in the design of a wearable pediatric artificial lung that consists of centrifugal pump integrated with a hollow fiber membrane (HFM) oxygenator.
-
The integrated pump on the artificial lung will be geometrically similar
to the Biomedicus BP-80 pump, but should be as small as possible.
CONCLUSION:
The stress strain curves for the nylon cable tie and porcine MCL are distinct, with the MCL having an initial nonlinear region during recruitment of ECM collagen fibers. The porcine MCL has a lesser modulus than the cable tie, suggesting that the MCL is more deformable than the cable tie when exposed to the same tensile forces. These mechanical properties mirror the distinct functions of each material.
REPORT SUMMARY
LAB SETUP
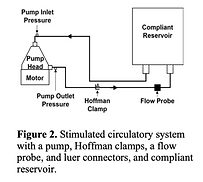
In order to have a continuous flow rotary pump small enough to be able to support a pediatric artificial lung, it must be able to withstand certain criteria. The pump must be able to produce a pressure equal to the pressure loss at 2.5 L/min at 2500 RPM. To be geometrically identical to the BioMedicus BP-80 pump (Figure 1), we must use the dimensionless relationship between CH and CQ to determine the smallest impeller diameter for the pressure demands. The smallest impeller diameter is important because the rotating impeller blades will overcome the resistance due to the HFM gas exchanger which creates the pressure differential through the pump. The most minimal diameter will allow for the creation of a pump small enough for a pediatric lung.
To collect this data, pressure and flow for the CMC (to mimic the properties of blood) were measured over a multitude of pump speeds for the Biomedicus BP-80 pump. First, the viscosity of the CMC was determined using an Ostwald viscometer (Model L230, Cannon Instrument Company, State College, Pa). A 0.5 mL load was applied to the CMC and the time was recorded when observing the CMC fall from higher to lower horizontal lines in the Ostwald Viscometer. Afterwards, the solution was then weighed via a laboratory scale. To remodel the vascular system, the pump was connected to 3/8” diameter tubing which was then connected to a compliant reservoir (Figure 2). For each of the four pump speeds (1000 RPM, 1500 RPM, 2000 RPM, 2500 RPM), the liquid pressure was measured before and after the pump as well as the volumetric flow rate and pressure without the Hoffman clamp. Flow rates were then measured with adjustments according to the application of the Hoffman clamp. Combining the knowledge and data we collected concerning flow rate, pressure differential, and pump speed, a pump curve was produced for the BioMedicus BP-80 pump.
TEST RESULTS


DISCUSSION
In this experiment, some measurements are made by humans with dial calipers; therefore, there is some concern about the impact of human error and reliability in the results. Repeatability is an important parameter to assess when making measurements, as more reliable measurements allow for drawing more powerful statistical conclusions. To assess the impact of repeatability, intraobserver and interobserver reliability were calculated for the length of a metal rod and the distance between the most superior point of the tibial plateau and the most inferior point of the tibial tuberosity. As predicted, intraobserver repeatability was significantly more precise for both observers (as seen by the lower standard deviation) in measuring the rod rather than the biological landmarks. This is likely due to the geometry of the systems measured. In the rod, the two points are very well defined and fit nicely between the prongs of the dial caliper; however, the points of tibia are more subjective, which introduces variability in selecting the points to measure between. Additionally, the two points do not fit within the caliper prongs, making it harder to use the instrument for the tibial measurements.
Interobserver repeatability was relatively constant for measurements within the rod, likely same reasons discussed above. For tibial measurements, however, there was a marked decrease in interobserver repeatability. This is to be expected when making measurements between two subjective points, as different people will measure the distance between slightly different points, creating a greater variability in the value measured. For this experiment, repeatability is a great concern when making cross sectional area measurements. Based on these results, the cross-sectional area of the cable tie should have a fairly high confidence, as the measurement is made between distinct points that can be enclosed by the prongs of the caliper. For the porcine MCL, measurements are made between distinct points mimicking the rod; however, the MCL cannot be enclosed by the prongs of the caliper, as the soft tissue will deform as the caliper is closed, resulting in inaccurate measurements. Thus, the distance must be measured without touching deforming the tissue, resembling the inability to close the two points of the tibia within the caliper prongs. All things considered, the cross-sectional area measurement of the cable tie should have a greater repeatability than that of the porcine MCL.
The nylon cable tie had a standard stress strain curve (Fig. 1). Initially, the curve is linear before the yield stress is reached, at which point it plateaus until failure at the midsubstance. The porcine MCL (Fig. 2) had a similar stress strain curve, with a linear region and a slight plateau before failure; however, the MCL also had an initial nonlinear, ‘toe’ region. This major difference is due to the intrinsic properties of the material. The MCL undergoes an initial deformation in which fibers of the extracellular matrix are recruited and aligned properly to counteract the loading, whereas the nylon cable tie has a fixed rigid geometry in which the entire cross sectional area is immediately engaged. The MCL had a much smaller modulus than the cable tie, meaning that the MCL is less stiff than the cable tie and requires less force per unit area to create a given deformation. This aligns with the different functions of each material. The nylon cable tie is commonly used to create a rigid attachment between two substances. If the cable tie were easily deformed, it would not meet its intended function. Conversely, the MCL is meant to create a flexible attachment between the femur and tibia. By being flexible and easily deformable, supports motion around the knee while maintaining the structural stability of the joint.
The cable tie manufacturer lists the tensile strength of the material as 222.5 N, corresponding to an ultimate stress of 33.2 MPa based on the cross-sectional area of the cable tie [2]. This is almost exactly the value experimentally determined in Table 2, providing support for the methodology and further support for the high reliability of measuring rigid materials. Unfortunately, the porcine breed used in this study is unknown, and different breeds of porcine have different mechanical properties [3]. Therefore, the calculated experimental values will be compared to the mean value between the Yorkshire and red Duroc values. Across the Yorkshire and red Duroc left and right MCLs, the mean modulus varied from 327.6 MPa to 477.8 MPa [3]. In this experiment, the porcine modulus was calculated to be 553.6 MPa (Table 2), which is reasonable as it still falls within one standard deviation of the left Yorkshire MCL modulus [3]. This variability likely comes from the innate variability between the pigs, including age, size, breed and physical activity before the MCL was harvested. Because the MCL failed at the tibial insertion site rather than the midsubstance, this study is unable to conclude the true ultimate strain or ultimate stress of the MCL midsubstance.
This study could be improved in future iterations to provide more physiologically representative data for the MCL. For example, the stress strain analysis could be repeated in a saline tank to prevent dehydration of the tissue. A heater could be added to this tank to determine the mechanical properties at physiological temperature rather than room temperature. Additional error may be the result of unprecise measurements with the dial calipers. Measuring deformable biological tissue presents an inherent challenge of getting accurate measurements, as touching the tissue can cause deformations creating inaccurate measurements. To obtain the most accurate and precise measurements, a non-contact imaging technique such as MRI or CT could be used to determine cross sectional area; however, the added time and cost may render such a technique impractical for a trivial improvement in precision.