VISCOELASTICITY LAB: PORCINE SKIN, SILLY PUTTY, AND CHEWED GUM
In my Biomechanics II course junior year of college, we were tasked with the responsibility of modeling the viscoelastic behavior of silly putty, porcine skin, and “chewed” gum and analyzing the behaviors of shear stress, shear strain, complex modulus, loss modulus, storage modulus, phase lag, and tangent of the phase lag behaviors with low (0.1 [Hz]), medium (1 [Hz]), and high (10 [Hz]) oscillation frequencies.
OBJECTIVE:
Assess the viscoelastic properties of various materials.
Use MATLAB:
-
Convert the force vs. time and displacement vs. time data to shear stress vs. time and shear strain
vs. time for each frequency and each material using the measurements of the specimen geometry
that you made in the lab. -
From your stress and strain versus time data sets, determine the phase lag and the magnitude of
the complex modulus of each material. Note: it may be different for each frequency. -
Use phase lag and complex modulus at each frequency to calculate storage modulus, loss modulus,
and tangent of the phase lag for each material. -
Generate three separate plots for each of the parameters in Step 3 versus frequency. Each plot
should contain three curves representing each of the materials with the parameter on the y-axis and
frequency on the x-axis. -
Comment on your observations during the experiments and knowledge of the physical behavior of each material compared to the properties determined in analysis. Therefore, compare and contrast the storage modulus, loss modulus and tangent of the phase lag for each material with respect to loading frequency.
CONCLUSION:
This experiment tests the viscoelasticity of putty, tissue, and gum using a Bose Fatigue Tester in a uniaxial setup. The Bose Fatigue Tester acts similarly to a subwoofer in that it consists of a shaft that moves freely back and forth through magnetic coils as a current is applied like the cone on a speaker. This in turn accurately controls the waveform in terms of spatial and temporal resolution. In other words, the Bose Fatigue Tester can accurately control both the amplitude and frequency of motion for the top plate which is attached to the shaft.
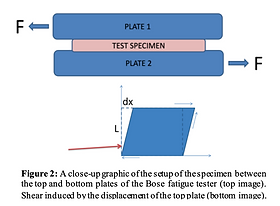
While the top plate is able to move, the bottom plate, connected to the load cell (see Fig. 1), is fixed, and does not move. The specimen of the experiment is placed between the two plates (see Fig. 2). The top plate then undergoes displacement as it moves back and force relative to the bottom plate. This induces a shear force on the specimen. The force collected by the load cell is the specimen’s resistance to the induced shear force by the top plate’s frequent displacement. This allows for calculation of the shear stress and the resistance to deformation, as the load is applied to the test specimen and therefore onto the bottom plate.
REPORT SUMMARY

LAB SETUP
This experiment tests the viscoelasticity of putty, tissue, and gum using a Bose Fatigue Tester in a uniaxial setup. The Bose Fatigue Tester acts similarly to a subwoofer in that it consists of a shaft that moves freely back and forth through magnetic coils as a current is applied like the cone on a speaker. This in turn accurately controls the waveform in terms of spatial and temporal resolution. In other words, the Bose Fatigue Tester can accurately control both the amplitude and frequency of motion for the top plate which is attached to the shaft.
While the top plate is able to move, the bottom plate, connected to the load cell (see Fig. 1), is fixed, and does not move. The specimen of the experiment is placed between the two plates (see Fig. 2). The top plate then undergoes displacement as it moves back and force relative to the bottom plate. This induces a shear force on the specimen. The force collected by the load cell is the specimen’s resistance to the induced shear force by the top plate’s frequent displacement. This allows for calculation of the shear stress and the resistance to deformation, as the load is applied to the test specimen and therefore onto the bottom plate.
EQUATIONS
RESULTS & PLOTS

DISCUSSION
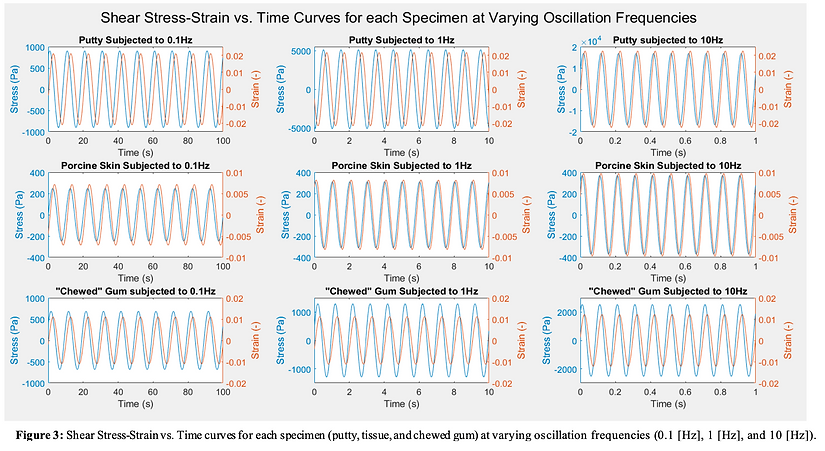
Stress-Strain vs. Time Relationship & Phase Lag
Plotted against time, shear stress and strain follow similar patterns for each of the nine experimental setups. An important relationship between the stress and strain curves is the difference between them, and the ratio of the peaks relative to one another. It is also important to note that a purely viscous material is exactly 90∘ out of phase. Thus, there is a phase lag of 90∘ or 𝜋/2 radians. Conversely, a purely elastic material is completely in
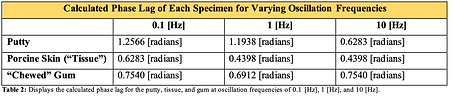
radians is considered to be viscoelastic. As seen in Figure 3, the putty exhibits a phase lag that decreases with an increasing oscillation frequency. This is observed by the shear strain curves approaching the shear stress curves as oscillation frequency increases from 0.1 [Hz] to 10 [Hz]. The decrease in phase lag indicates that the putty exhibits more elastic behavior as the oscillation frequency increases. Looking at Table 2, the phase lag for putty is above 𝜋/4 radians (45∘) at 0.1 [Hz] and 1 [Hz]. The phase lag at 0.1 [Hz] is also greater than the phase lag at 1 [Hz]. Thus, the putty initially experiences a more dominant viscous behavior. As the oscillation frequency increases, the elastic behavior of the putty becomes more and more dominant. At 10 [Hz] the phase lag of the putty is below 𝜋/4 phase with no phase lag. Any phase lag between 0∘ and 90∘ or 0 and 𝜋/4 radians (45∘) thus indicating dominant elastic behavior. Additionally, the porcine skin exhibits a phase lag that decreases with an increasing oscillation frequency at a slower rate than the putty. This is shown in Figure 3 by the shear strain curves approaching the shear stress curves at a slower rate than in the putty. In Table 2, an initial decrease in tissue phase lag from 0.1 [Hz] to 1 [Hz] and then the seemingly constant behavior of the phase lag from 1 [Hz] to 10 [Hz] can be observed. It is also important to note that the phase lag of the tissue is always below 𝜋/4 radians (45∘) from 0.1[Hz] to 10 [Hz]. This means that the tissue is already more dominant in elastic behavior and its elastic behavior becomes slightly more dominant as oscillation frequency increases. Finally, for the “chewed” gum, in Figure 3, the shear stress curves and shear strain curves appear to remain equidistant from one another as the oscillation frequency increases. This seemingly constant behavior is confirmed in Table 2 as the phase lag of the gum decreases ever so slightly from 0.1 [Hz] to 1 [Hz], then
increases again from 1 [Hz] to 10 [Hz] to the previous phase lag value. This phase lag value is slightly below 𝜋/4 radians (45∘). This means that the gum is fairly distributed in elastic and viscous behaviors. The slight increase in elastic behavior at 1 [Hz] can potentially be attributed to noise.
Storage Modulus, Loss Modulus, and Tangent of the Phase Lag
The storage and loss moduli are analyzed together as a ratio. Therefore, when the storage modulus is larger than the loss modulus, elastic properties of the material dominate, and when the loss modulus is larger than the storage modulus, the viscous properties of the material dominate. This can be seen by the tangent of the phase lag plot in Figure 4 as tan(delta) is equal to the ratio between loss and storage moduli. It is important to remember that tan() is equal to the loss modulus over the storage modulus. This can be easily visualized, as tan(delta) will be less than 1.0 [radian] when elastic properties dominate and greater than 1.0 [radian] when viscous properties dominate. Additionally, the tan(delta) can be considered analogous to the complex modulus which describes the overall stiffness of a material and is found by the ratio between the loss and storage moduli. Though not identical, tan() and the complex modulus essentially describe the same thing: the stiffness of a material due to the peak stresses and strains experienced. Using the plots in Figure 4 to quantify and analyze these values, we can prove that putty is more viscous than elastic at low and medium frequencies and more elastic than viscous at high frequencies. The tan(delta) is significantly larger than 1.0 at the low and medium oscillation frequencies, indicating that the loss modulus is larger than the elastic modulus. This then flips, and the elastic modulus is larger than the loss modulus at higher oscillation frequencies and is thus supported by a tan(delta) value of <1.0 [radians]. The porcine skin displays the most constant behavior of any material tested regarding viscosity and elasticity. This biological tissue more dominantly exhibits properties of elastic materials, as tan() is less than 1.0 [radian] for all tested oscillation frequencies. The tangent of the phase lag is closer to 0.75 [radians] at low frequencies, but still remains more elastic than viscous. The chewed gum also demonstrates prominently elastic material properties, but the degree of elasticity is less than that of the porcine skin. The tan() values fluctuate ever so slightly just under 1.0 [radian]. This fluctuation in the tan(delta) could be attributed to noise. The tan(delta) can be confirmed using the loss and storage moduli plots. Where the storage modulus is larger than the loss modulus, a tan() value of <1.0 [radian] is observed thus indicating dominant elastic behavior. When the loss modulus is larger than the storage modulus, a tan(delta) value >1.0 [radians] is observed thus indicating dominant viscous behavior. This correlation can be observed for the putty, “chewed” gum’ and porcine skin.